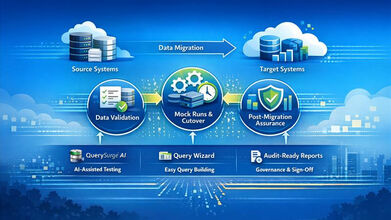
Data Migration Testing
Migrate data with confidence, not guesswork, with QuerySurge's no-code solutions
The contemporary enterprise landscape is defined by a relentless drive toward digital modernization, a process that necessitates the large-scale movement of critical information across increasingly complex technological architectures.
Whether organizations are transitioning from legacy on-premises systems to agile cloud environments, shifting between software vendors, or consolidating disparate data silos into unified data lakehouses, the process of data migration stands as a central, albeit high-risk, pillar of IT strategy.1
Despite the clear business advantages of modernization, data migration remains one of the most significant challenges for IT leadership due to the massive volumes of data involved and the critical nature of the information being moved.1
Statistical analysis from industry observers like Gartner indicates a staggering 83 percent failure rate for data migration projects, which frequently exceed their allocated timeframes and financial budgets.1 This failure is not merely a technical inconvenience; it represents a systemic risk that can lead to operational paralysis, financial loss, and severe damage to brand equity.
The primary objective of a robust data migration testing strategy is the mitigation of these risks through the systematic validation of data integrity, accuracy, and completeness throughout the migration lifecycle.1
By confirming that data has been successfully transformed and loaded into the target system according to predefined business rules, organizations can avoid the "bad data" incidences that cost the average company approximately $14.2 million annually.3
This report provides an exhaustive analysis of the data migration testing ecosystem, examining the quantitative risks of failure, the technical taxonomy of data defects, the role of artificial intelligence in automation, and a comprehensive visual design blueprint for communicating these concepts through high-impact infographics.
The scale of data migration failure is best understood through the lens of empirical metrics. Data migration is often underestimated in its complexity, leading to significant overruns. Research from the Bloor Group indicates that over 80 percent of migration projects fail to meet their initial expectations regarding timeline and budget.1 The financial ramifications are profound, with the average cost of a data migration project sitting at approximately $875,000.1 When these projects fail or encounter delays, the secondary costs associated with downtime and remediation often eclipse the initial investment.
Metric Category |
Industry Statistic |
Primary Source |
|---|---|---|
Project Failure Rate |
83% of projects fail to meet expectations |
Gartner1 |
Budget Performance |
> 80% run over time or budget |
Bloor Group1 |
Average Cost Overrun |
30% above initial budget |
Bloor Group1 |
Average Time Overrun |
41% beyond initial schedule |
Bloor Group1 |
Average Migration Cost |
$875,000 per project |
QuerySurge Analysis1 |
Data Corruption Rate |
38% of migrations experience corruption |
QuerySurge Analysis1 |
Data Loss Rate |
34% of migrations experience missing data |
QuerySurge Analysis1 |
One of the most critical risks identified in migration initiatives is unexpected downtime. Approximately 64 percent of migration projects suffer from unforeseen outages.1 The economic impact of this downtime is highly sector-dependent, reflecting the degree to which modern business operations are intertwined with real-time data availability. For a brokerage firm, the cost of a single hour of downtime can reach $6.5 million, while for energy companies, the figure stands at $2.8 million.1 Even for general Fortune 1,000 companies, the cost is estimated at $1 million per hour.1 These "scary metrics" underscore the necessity of a rigorous validation process to ensure that the "cutover" from legacy to new systems occurs without paralyzing the organization.
Industry Sector |
Cost of Downtime per Hour |
|---|---|
Brokerage and Financial Trading |
$6,500,000 |
Healthcare and Pharmaceuticals |
$5,000,000 |
Manufacturing and Logistics |
$5,000,000 |
Media, Telecom, and Retail |
$5,000,000 |
Energy and Utilities |
$2,800,000 |
Fortune 1,000 Companies |
$1,000,000 |
The causal relationship between inadequate testing and these financial outcomes is direct. Without 100 percent data validation, organizations rely on sampling—often checking less than 1 percent of their data—leaving 99 percent of the dataset as a potential source of failure.4 This "sampling trap" creates an illusion of quality while allowing systemic errors in transformation logic to propagate into the production environment.
A successful testing strategy must be informed by a deep understanding of the specific ways in which data can be corrupted or lost during the migration process. These "data bugs" are frequently the result of misinterpreted business rules, architectural mismatches between source and target systems, or failures in the ETL (Extract, Transform, Load) logic.1 QuerySurge identifies several typical categories of bad data that must be pinpointed to prevent adverse business impacts.1
(To expand the sections below, click on the +)
Structural and Mapping Defects
Missing data is perhaps the most obvious defect, occurring when records fail to transfer to the target database.1 This often stems from invalid joins in the transformation code or incorrect lookup tables. For instance, if a source field contains an unexpected value that does not match a lookup table, the resulting record may be nullified or excluded entirely, leading to gaps in financial or operational reporting.1 Truncation of data is another common structural issue, usually caused by insufficient field lengths in the target database. A classic example is a city name like "New Mexico City" being truncated to "New Mexico C" because the target schema was not configured to accommodate the maximum length of the source data.1
Data type mismatches occur when the architectural definitions of the source and target systems are not aligned.1 If a source field configured as a date is migrated into a target field defined as a VarChar, the data may lose its functional utility for time-based analytics or sorting, even if the text itself appears correct. Similarly, misplaced data occurs when source fields are mapped to the wrong target fields, such as populating "First_Name" with "Last_Name" data due to human error in the mapping documentation.1
Logic and Transformation Anomalies
The transformation stage of migration is where business logic is applied, and it is also where the most sophisticated errors occur. Null translation errors arise when the development team fails to account for how null values should be represented in the new system.1 For example, a null value in a legacy database might be intended to mean "None" in the target system; if this logic is omitted, the null remains, potentially breaking downstream applications that do not expect nulls in those fields.1
Conversely, wrong translation errors involve populating a field with an incorrect non-null value. This might happen if a business rule intended to convert numerical codes into descriptive strings is applied incorrectly.1 Transformation logic "holes" are particularly dangerous because they often represent edge cases that were never documented.1 These include special characters or international symbols that the ETL code cannot process, resulting in rejected rows or corrupted strings that may go unnoticed until they appear in a critical executive dashboard.1
Bug Classification |
Technical Description |
Business Impact |
|---|---|---|
Missing Data |
Records present in source but not in target. |
Incomplete financial or regulatory reports. |
Truncation |
Data cut off due to insufficient field length. |
Loss of critical identifying information. |
Data Type Mismatch |
Incorrect target field definitions (e.g., Date vs String). |
Functional failure of analytics and sorting. |
Null Translation |
Failure to convert source nulls to specific target values. |
Application errors and null pointer exceptions. |
Misplaced Data |
Mapping source data to the incorrect target column. |
Operational confusion and incorrect record-keeping. |
Extra Records |
Inclusion of data that should have been filtered out. |
Skewed sales totals and duplicate billing. |
Transformation Holes |
Unaccounted edge cases (e.g., international characters). |
Rejected rows and failed end-of-year reporting. |
Sequence Issues |
Incorrectly configured sequence generators. |
Duplicate primary keys and audit failures. |
Numeric Precision |
Rounding errors in currency or scientific data. |
Financial inaccuracies and skewed KPIs. |
The identification of these bugs is not a one-time event but requires a repeatable strategy.1 Without automated pinpointing, these defects can linger in the system, causing cumulative damage as "bad data" informs more and more business decisions. Gartner suggests that nearly one-third of analysts spend over 40 percent of their time simply vetting and validating data before it can be used, a massive drain on corporate productivity.3
To effectively manage the complexity of moving billions of records, a structured lifecycle is required. Industry best practices categorize the migration testing process into three distinct phases: pre-migration, the migration execution phase, and post-migration validation.2 This phased approach ensures that testing occurs before, during, and after the data is moved, providing a continuous safety net for the organization.2
(To expand the sections below, click on the +)
Phase 1: Pre-Migration Strategy and Profiling
The pre-migration phase is foundational, focusing on preparation and risk assessment. Objectives must be clearly defined, identifying whether the migration is driven by consolidation, cloud transition, or system upgrades.9 A critical activity in this phase is data profiling, which uses automated tools to assess the quality, volume, and structure of the source data.9 This allows teams to understand the level of "data debt" they are carrying into the new system.
Data cleansing is also a priority during this stage. By rectifying or eliminating corrupted, improperly formatted, or duplicate records in the legacy system, organizations ensure they are not simply migrating problems into a more expensive environment.8 Data mapping follows, where field-level transformations are outlined and validated against the target schema.9 This phase essentially builds the blueprint for the migration, establishing the "Source-to-Target" mappings that will serve as the requirements for all subsequent testing.6
Phase 2: Migration Execution and Real-Time Validation
During the execution of the migration, the focus shifts to monitoring and iterative validation. Organizations often conduct "trial migrations" or pilot tests using representative subsets of data.9 This allows for the identification of performance bottlenecks and recurring error patterns before the full dataset is moved. Real-time monitoring is employed to track error rates and throughput, ensuring that if a significant issue arises—such as a network failure or a logic error that causes mass data corruption—the process can be halted or remediated immediately.9
Phase 3: Post-Migration Integrity and Functional Reconciliation
The final phase, post-migration testing, is the most rigorous. It involves a process often referred to as data reconciliation, where the target system is compared against the source system to confirm that all data was transferred correctly and its quality remains intact.2 This is not limited to row counts; it includes cell-level validation of every record moved.4
Functional testing is also critical at this stage to confirm that the migrated data is accessible and usable by the application layer.2 Performance testing ensures the target system can handle the production volume of data and transactions within user expectations.2 Finally, rollback testing is performed to verify that, in the event of a catastrophic post-migration failure, the organization can swiftly revert to the legacy system without disrupting business operations or losing previous functionality.8
Stage |
Action Step |
Key Activities |
|---|---|---|
Planning |
Requirements Gathering |
Define scope, success criteria, and historical data requirements.10 |
Strategy |
Environment Setup |
Mimic production environments and define entry/exit criteria.10 |
Preparation |
Test Data Selection |
Include edge cases, nulls, and high-volume scalability samples.10 |
Execution |
Core Validation |
Compare source/target record counts and field values.8 |
Refinement |
Defect Management |
Track discrepancies by severity and perform iterative retesting.10 |
Verification |
Post-Migration Validation |
Final reconciliation in the live environment and stakeholder sign-off.10 |
The traditional reliance on manual testing or spot-checking is no longer sustainable in the era of Big Data. Manual validation is slow, prone to human error, and lacks the scalability required to verify billions of records.5 To address these challenges, enterprise-grade tools like QuerySurge have introduced AI-powered automation to the data validation landscape.
(To expand the sections below, click on the +)
AI-Driven Test Creation and the Mapping Intelligence
QuerySurge leverages generative artificial intelligence to automate the most time-consuming aspect of ETL testing: the creation of transformational tests.1 Historically, a tester would need to manually write SQL queries for both the source and target systems, a process that could take hours for a single complex mapping. QuerySurge AI can convert hundreds of these mappings into tests in minutes.1 This "Mapping Intelligence" module creates native SQL tailored to the specific data stores involved, drastically reducing the dependency on highly skilled SQL developers and allowing for a "shift-left" strategy where testing begins much earlier in the development cycle.4
The Query Wizard and Low-Code Accessibility
For organizations that may not have extensive SQL expertise across their QA teams, the platform offers "Query Wizards." These provide a graphical interface for fast and easy validation without coding. The Wizards can automatically link columns to create tests, add filter conditions, and verify table-to-table or column-to-column comparisons.1 This capability is essential for validating hundreds of tables in a single session, a task that would be impossible for a human team performing manual comparisons in Excel.12
DevOps for Data and Continuous Integration
The integration of data testing into the CI/CD (Continuous Integration/Continuous Delivery) pipeline is a key differentiator for modern migration projects. QuerySurge provides an extensive RESTful API and command-line interface (CLI) with over 60 API calls, allowing testing to be triggered by events like the completion of an ETL build.6 This "DevOps for Data" approach ensures that data issues are detected continuously, acting as a quality gate that prevents bad data from ever reaching the production environment or the BI reporting layer.11
Capability |
Manual Testing |
QuerySurge Automation |
|---|---|---|
Data Coverage |
< 1% (Sampling) |
100% of all data.4 |
Speed of Execution |
Slow (Days/Weeks) |
Fast (Minutes/Hours).6 |
Accuracy |
Prone to human oversight |
High-precision cell-level comparison.13 |
Skill Requirement |
High SQL proficiency |
Low-code/No-code options available.1 |
Pipeline Integration |
Siloed and manual |
Native CI/CD & DevOps integration.11 |
Audit Trail |
Often incomplete or manual |
Full audit logs of all test actions.13 |
The business case for investing in automated data migration testing is substantiated by significant labor savings and the avoidance of "bad data" costs. When enterprises transition from manual sampling to automated validation, the return on investment is not just incremental; it is transformative.
(To expand the sections below, click on the +)
The 877% ROI Calculation
A detailed analysis of QuerySurge's AI module versus traditional in-house testing methods reveals a projected ROI of 877 percent over a three-year project cycle.3 This calculation is based on a project involving 1,200 tests and 36 test cycles (12 per year). In a manual environment, the time required for test design, execution, and analysis for 1,200 tests would cost an organization hundreds of thousands of dollars in consulting or internal labor.3 By contrast, the AI-powered approach reduces the "Test Design" time for 1,200 tests from 1,200 hours down to just 6 hours.3
Expense Category |
In-House Testing (Manual) |
QuerySurge + AI (Automated) |
|---|---|---|
Test Design (1,200 Tests) |
$114,000 |
$570 |
Subscription Licenses |
$0 |
$30,062 |
Execution/Analysis (Per Cycle) |
$114,760 |
$760 |
Report Creation (Per Cycle) |
$2,280 |
$95 |
Total After 1 Cycle |
$231,040 |
$31,487 |
Total After 36 Cycles |
$881,220 |
$90,186 |
Projected 3-Year ROI |
-- |
877% |
Note: Calculations assume a consulting rate of $95/hour.3
Beyond labor savings, the platform addresses the cost of poor data quality, which Gartner estimates at $14.2 million annually for the average enterprise.3 By catching defects early, organizations avoid the fallout of misinformed business decisions, operational delays, and regulatory penalties. Case studies demonstrate that this efficiency translates to real-world savings; for instance, a contract research organization (CRO) saved $288,000 on a single clinical trials data migration project by automating their validation processes.1
Impact on Human Capital
Automation allows for the redeployment of highly skilled personnel. Instead of data analysts and engineers spending 40 percent of their time performing repetitive validation tasks, they can focus on higher-value activities like data architecture, strategic analytics, and system optimization.3 This shift not only improves productivity but also increases team morale by eliminating the "bottleneck" reputation of the QA department.4
The efficacy of automated data migration testing is best demonstrated through documented case studies. These examples highlight how organizations in high-stakes industries have successfully navigated the challenges of modernization.
(To expand the sections below, click on the +)
Insurance Sector: Transitioning to the Cloud
A leading insurance company recently partnered with TestingXperts to migrate billions of records from a traditional legacy data warehouse to a new cloud-based solution.7 The organization faced significant challenges with manual checks, which frequently allowed data mismatches and incomplete transfers to enter production.7 By implementing QuerySurge, they were able to execute over 2,300 automated tests (QueryPairs), validating data across the "bronze, silver, and gold" layers of their data architecture.7
The implementation resulted in several key benefits:
Clinical Research: Cost and Time Savings
A Contract Research Organization (CRO) involved in a significant clinical trials data migration project provides another compelling example. By automating the validation process with QuerySurge, the organization saved $288,000.1 In the highly regulated world of clinical trials, where data accuracy is literally a matter of life and death and regulatory compliance is mandatory, the ability to achieve 100 percent validation was a critical success factor.
In the competitive landscape of data testing tools, QuerySurge occupies a specialized position as a precision instrument for high-volume, enterprise-grade validation. While other tools may offer broader data management features, QuerySurge’s focus on automation and AI-driven test generation makes it the superior choice for complex environments.
Compared to platforms like RightData and DataGaps, QuerySurge offers deeper integration with DevOps workflows and more mature AI capabilities. While RightData serves data engineers well, QuerySurge is designed for the broader QA, BI, and DevOps teams, offering more robust test management integrations.13 Competitors often rely on manual configuration for complex validations, whereas QuerySurge's generative AI can automatically build test suites from natural-language prompts or mapping documents.13
Another key differentiator is the "BI Tester" module. Many data testing tools stop at the database layer. QuerySurge extends its validation to the visualization layer, ensuring that what the CEO sees on a Power BI or Tableau dashboard is a perfect reflection of the underlying data.11 This "source-to-dashboard" validation is unique in the market and provides a level of end-to-end security that few other platforms can match.
Strategic Category |
QuerySurge Advantage |
Competitor Limitation |
|---|---|---|
AI Integration |
Generative AI for SQL test creation.4 |
Limited to basic templates or manual SQL.13 |
DevOps Maturity |
60+ API calls and Swagger documentation.14 |
Basic script-based integration.13 |
Connector Library |
200+ prebuilt data store connections.4 |
Narrower focus or limited legacy support.19 |
Visual Layer Validation |
Native modules for Power BI, Tableau, etc.11 |
Requires separate tools or manual spot-checks.13 |
Deployment Models |
On-prem, Cloud, and Hybrid flexibility.13 |
Often limited to cloud-only SaaS models.13 |
The modernization of enterprise data infrastructure is an inescapable necessity in the current digital economy, yet the risks associated with data migration remain a formidable barrier to success. The high failure rate of migration projects—driven by budget overruns, time delays, and the catastrophic costs of downtime—is fundamentally a testing and validation problem. As organizations move toward increasingly massive datasets and distributed architectures, the traditional reliance on manual sampling is no longer a viable strategy for maintaining data integrity.
The strategic implementation of an automated, AI-powered testing framework offers a definitive solution to these challenges. By moving from less than 1 percent data coverage to 100 percent validation, organizations can effectively eliminate the "bad data" that skews analytics and leads to operational failure. The technical architecture of QuerySurge, with its Query Wizards, Mapping Intelligence, and DevOps integration, provides the necessary tools to transform data validation from a project bottleneck into a competitive advantage.
Furthermore, the economic case for automation is overwhelming. With a projected ROI of 877 percent and proven labor savings of hundreds of thousands of dollars, the investment in automated testing pays for itself many times over. The ability to shift-left, identifying defects early in the pipeline, reduces the total cost of quality and ensures that the brand impact of a migration is one of modernization and growth, rather than failure and disruption.
Finally, the visual communication of these concepts through structured infographics is essential for aligning stakeholders and demonstrating the value of rigorous testing. By following established branding guidelines and focusing on the most critical metrics—the "scary" risks and the "transformative" results—organizations can foster a culture of data quality that extends from the IT department to the boardroom. As data continues to grow in both volume and criticality, the "Data Integrity Imperative" will only become more central to the success of the modern enterprise. Consistent adherence to these principles of automation, phased testing, and visual clarity will define the next generation of successful data migration initiatives.